How much is a goal worth?
All right, let's get ourselves into a situation here. You are a hockey player playing a final four. The semifinals were super tough. Five seconds to the end the game and a tied score! Absolute madness. Everyone was waiting for the mandatory overtime after regulation. But there you go. Somehow you managed to anticipate that one pass. You managed to steal the ball and control it. And then you made the 30m sprint of your life, fooled the goalkeeper, and… OMG! You scored to be one up! With only two seconds left in the game, you scored the goal that was about to place your team in the final. And it sure did. There was just enough time for the other team to take a desperate shot without consequences on the score. You made it to the final. Congratulations! Yeah, let's enjoy the moment. It was awesome. Such a great feeling! And then, the next day, you scored another goal in the final! Geez, congratulations again! I'm sorry you lost the final 4 to 1, though. Despite your early goal, only 2 seconds after the start of the game, the other team was superior. It's hard to say, but despite your team's strategy, the other team's players had unreal technical skills. But congratulations again. Only two teams reached the final, and your team was one. And you scored in the semifinal and the final! Do they give an award for the earliest goal in the competition?
I know this is a little recreation but bear with me. How would you feel? I bet you empathize with the situation. You're prone to have the same opinion that most of us have deep inside: not all goals are equal. The goal in the semifinal was determinant, while the goal in the final kind of anecdotic. Both goals set the team one up. But two seconds from the start or two seconds to the end of the game made a huge difference. Yet, all we do in our sport is count how many goals players score and generate a list of Top Goal Scorers. We add them together as if all goals were equal, even though we know they're not. Current stats measure just quantity, not relevance. Addressing goal relevance would help us estimate how much goals are worth. We would also understand the value of the goals and the players. It would provide additional information to complement the current stats on Top Goal Scorers. But can we seriously measure objectively how much a goal is worth? Here, in okjectivity, we believe so. And that's why we will show you an "okjective" way to estimate goal value and a few examples of how you can use that metric to uncover the performance of your players and team.
The Adjusted Goal Value (AGV) statistic
In okjectivity, we're all for impartiality and simplicity. We decided to estimate the value of a goal based on one of the sport's best-established and most widely accepted facts. We hope our approach minimizes doubts and maximizes understanding of the Adjusted Goal Value (AGV) and the additional metrics we will build upon it. We're positive you will agree, as this fact is widespread in many sports. A team victory is worth three points, a tie is worth one point, and a loss is worth zero points. Of course, victories, ties, and defeats are worth much more than just the points. But as to league rankings is concerned, they are worth three, one, and zero points. That's incontestable. And we're fortunate because we're attempting to address how much a goal is worth, and somebody put the value for us. We just need to think in terms of goals, not in terms of victories, ties, or losses.
So this is our rationale. All games start with a tie. A score of 0 – 0. One point to each team. No goals in a game? That's what the teams get—one point. If a team wants to earn three points, it needs to score at least one goal. Imagine there's only one single goal in a game. That single goal is worth two points, to a final value of three points for the victory. No matter how many more goals that same team scores in the game, it will not earn more points. Just a total of three for the victory, regardless of the goal difference. A team ending a game with a goal difference of one, four, or thirteen will earn three points. A team with a zero goal difference will get one point, and a team with a negative goal difference zero points. We knew all goals were not equal. Now we understand their value depends on the goal difference. If a team wins 1 – 0, that goal is worth two points, and no additional goal will be more valuable. A score of 2 – 0 will add more confidence in the victory but adds no additional value to the game. So what's the value of the second goal? Simple, the two additional points for the win over the two-goal difference, i.e., a value of one. That second goal is worth one point because the trailing team should score two goals for the leading team to lose the two "winning" points. If the leading team scores a third goal for a 3 – 0 score, again, it adds no more value, just a bit more confidence in keeping those two winning points. Now the trailing team needs three goals for the winning team to lose the two additional points, so two points over three goals equal 0.667. You got the idea. For any given positive goal difference, each goal is worth two points over the goal difference resulting from the goal. And that's true regardless of the actual number of goals the team has scored.
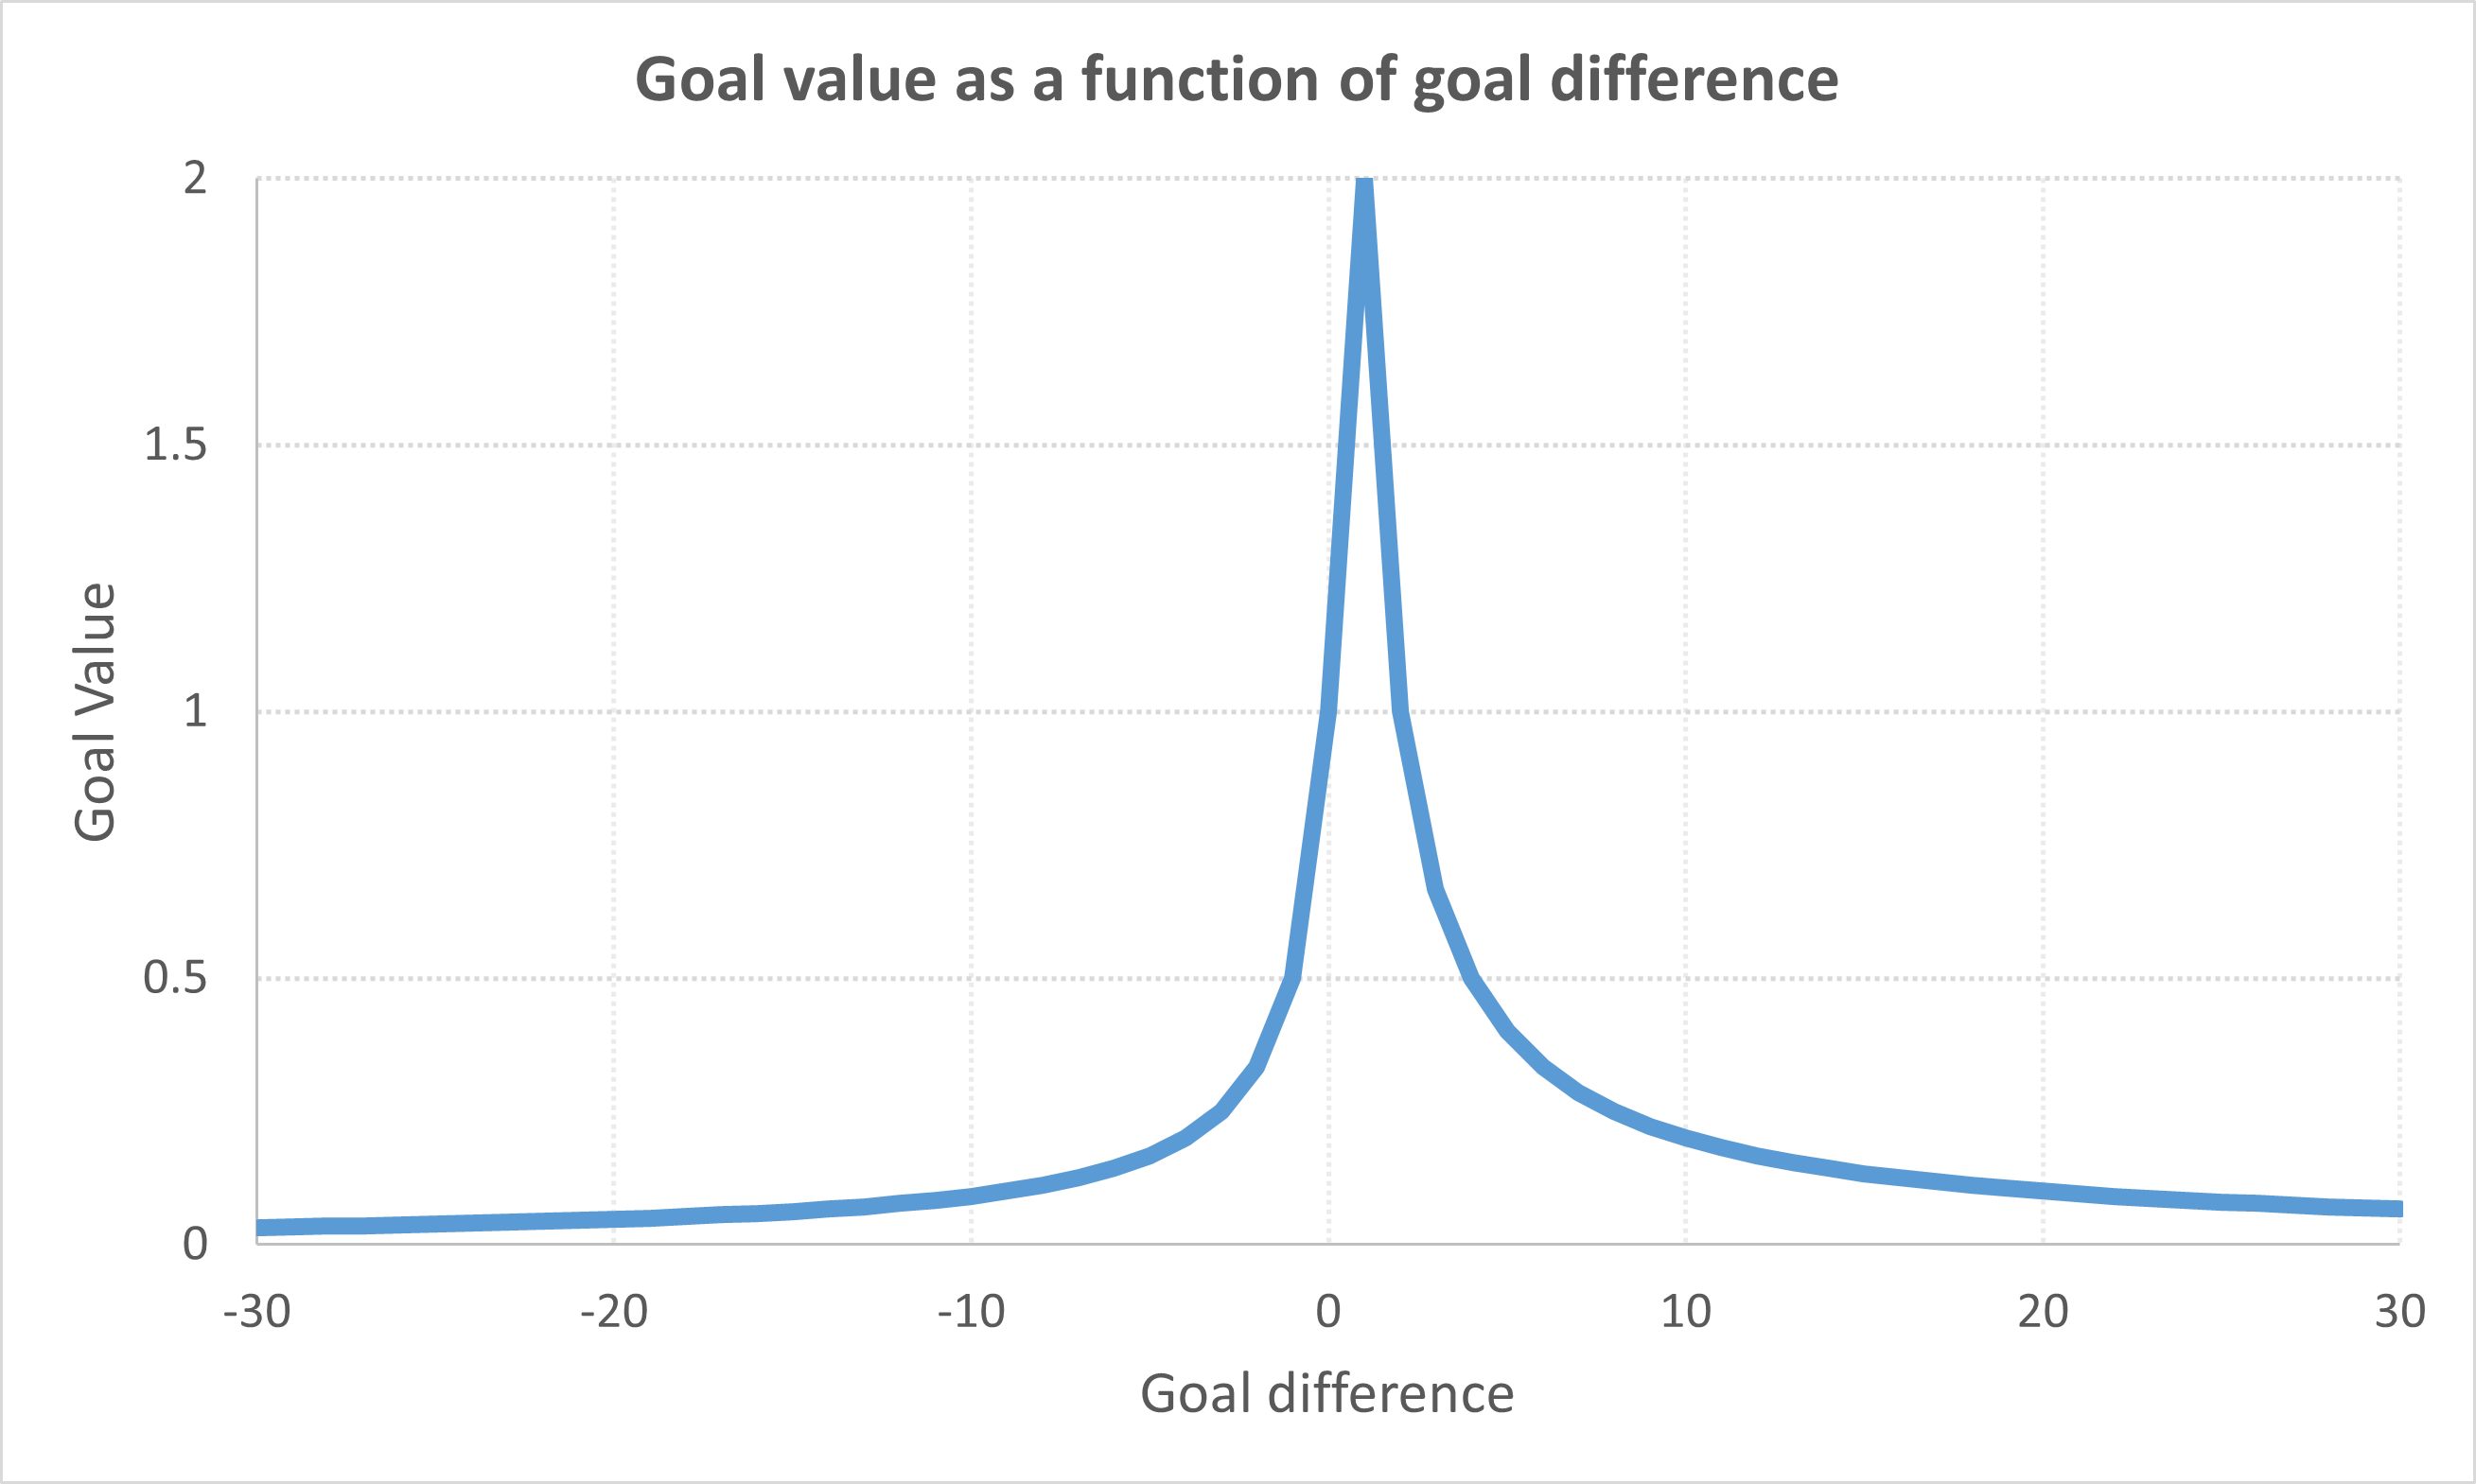
So, what happens when the team ties? We apply the same logic, but now the value is one rather than two because a tie is worth one point. If a team scores a goal and ties the game, it was losing. In other words, it had zero points and scored a goal that gave the team one point. So, simple, that goal is worth one point. What if the trailing team has a negative goal difference larger than one, so still losing after scoring a goal? Once again, we apply the same rationale we used before with the positive goal difference. It's just that now the trailing team must tie before it can win, so it's one point over the goal difference before scoring the goal. If a team losing 2 – 0 scores to a 2 – 1, the goal is worth 0.5 because the trailing team needs two goals to tie the game. If a team losing 4 – 0 scores to a 4 – 1, that goal is worth 0.25 points because the trailing team needs four goals to tie, so one point over a four-goal difference. You can see the distribution of the goal value (y-axis) over the goal difference (x-axis) in the figure below. The most valuable goal is that resulting in a positive goal difference of one. Then, the larger the goal difference, the smaller the goal value. And, given the same goal difference, a winning team's goals value more than a losing team's goals because losing teams need to tie before they have an option to win (that is, they have to earn one point before they can opt for the two additional winning points).

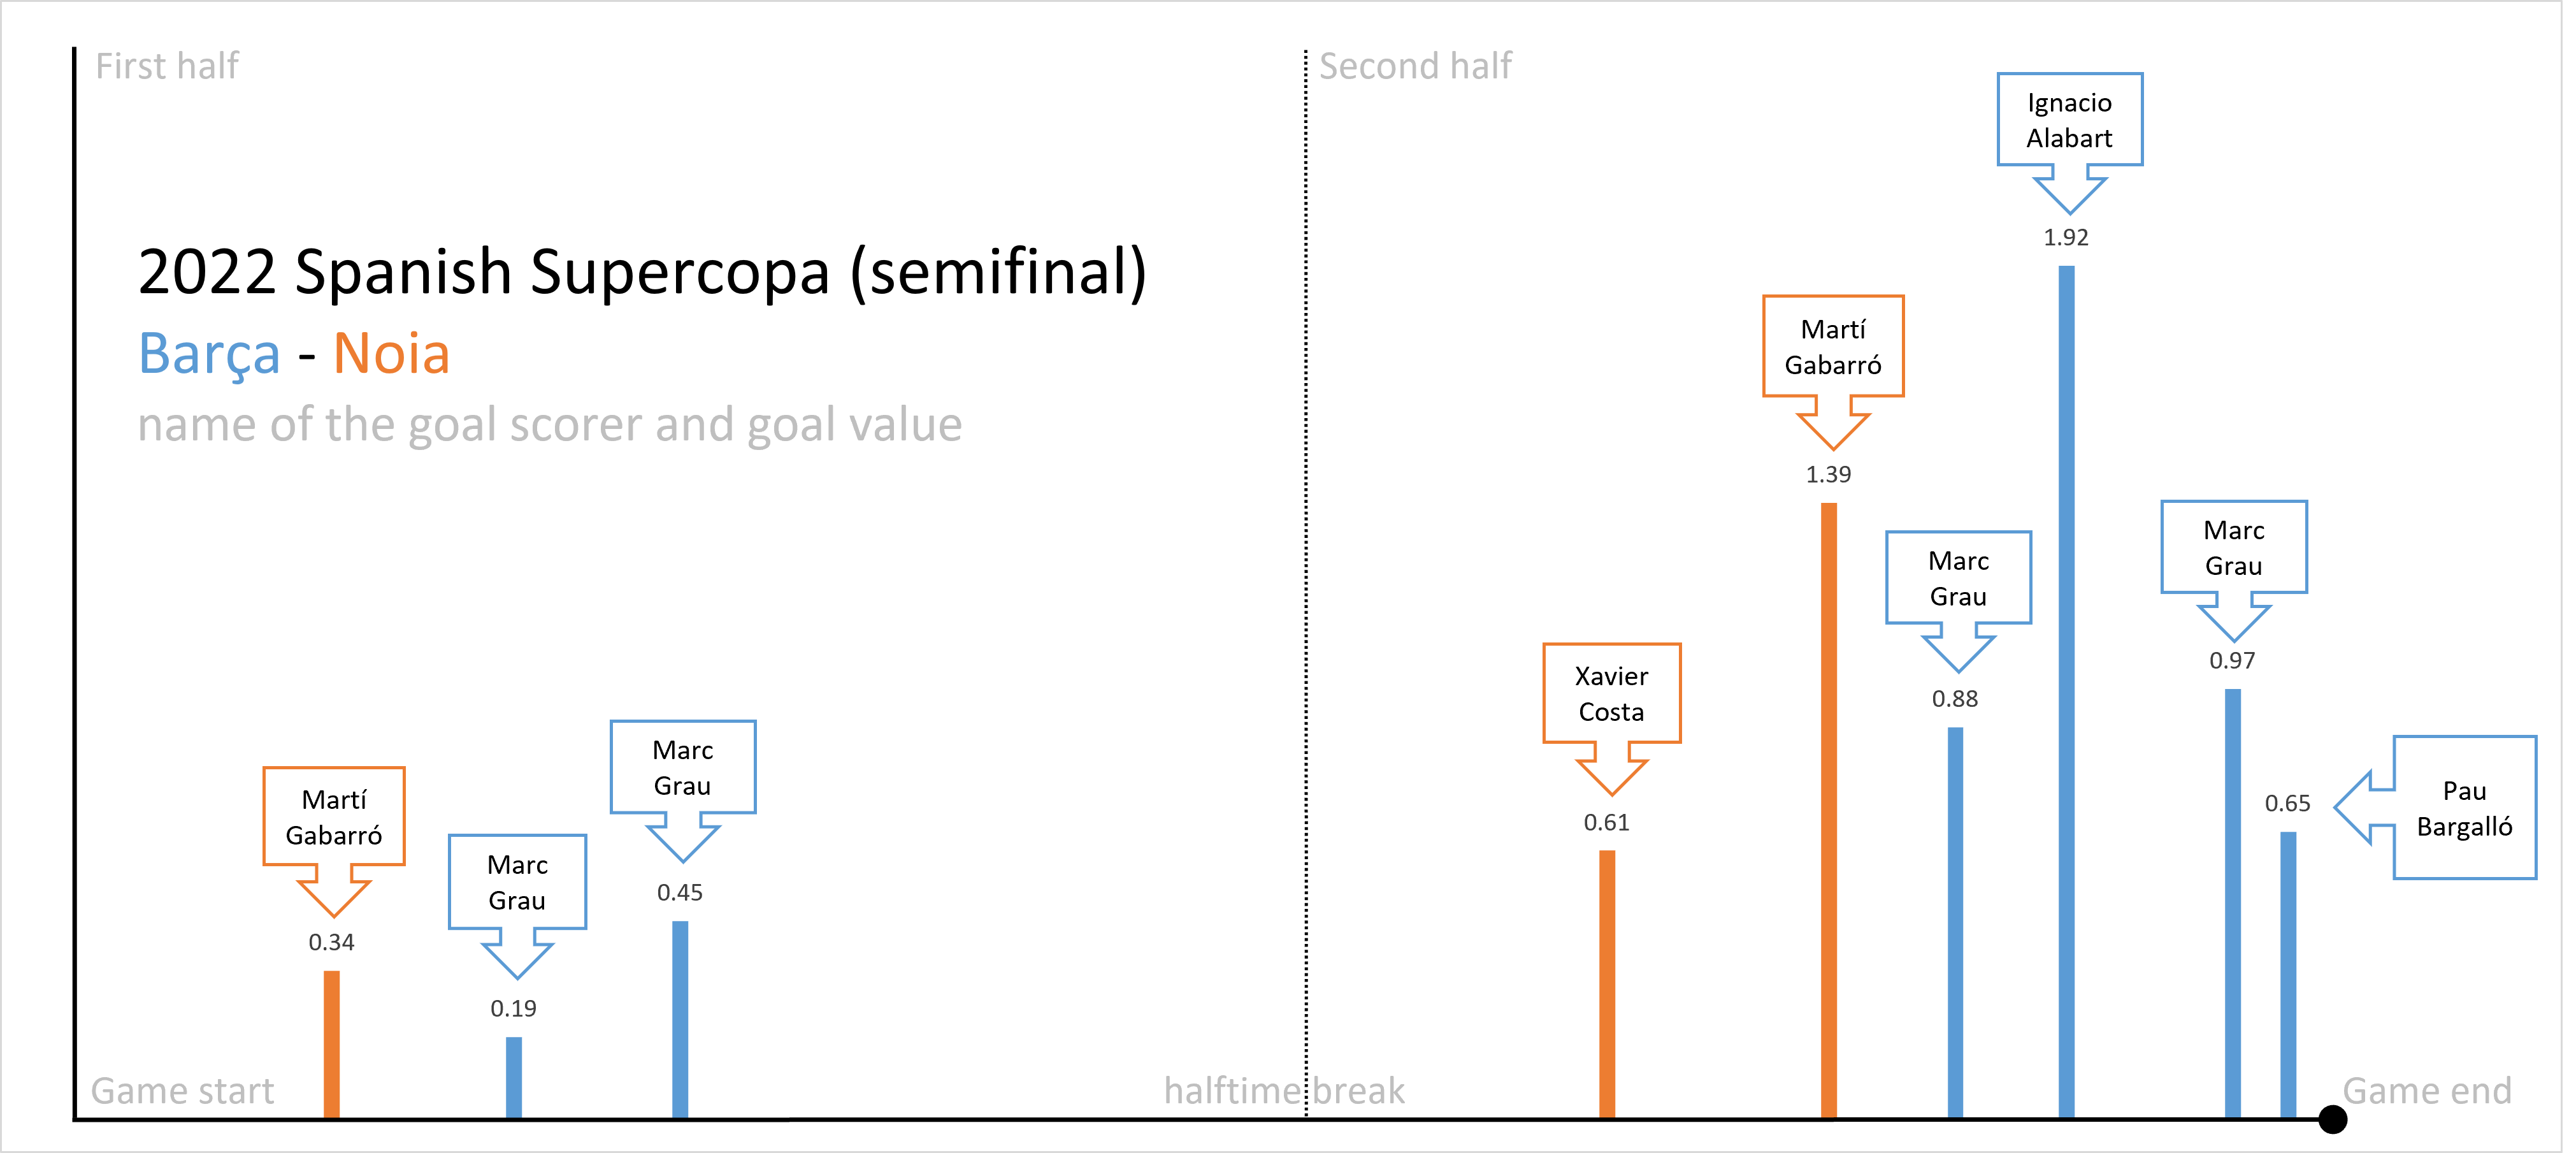
So, is that the value of any goal in a game? Well, that's only half the story. That would be the value if the game ends with the goal. But there may be enough time left to change the score and the game's final outcome. So the other half of the story must be time. We made it clear at the blog's beginning that a one-goal difference can be temporal or final, depending on the time of the game. Goal differences are prone to change at the beginning or be final at the end of a game. Of course. Nothing new here. So we used the time when the goal is scored as a variable to regulate the goal value and obtain the Adjusted Goal Value (AGV). We simply multiplied the goal value by the time (in seconds) when the goal is scored over the game's total number of seconds to obtain the corresponding AGV. The AGV varies between zero and three. The largest AGV value will identify the most determinant goal in the game, which is bound to differ depending on the actual goal difference and the time when the goal materializes. Below is a graphic with the AGVs of the Barça – Noia semifinal in the Spanish Supercopa held in Olot in September 2022.

Offensive Contribution to Victory
Cool. It's nice to know the game's most determinant goal and who the player is. But is the highest AGV player the game's most determinant player too? Not necessarily. To measure how much each player contributed to the team's victory, we need to measure the players' Offensive Contribution to Victory (OCV). This metric aggregates all the AGVs for any player, so we can compare how players contributed to the final score. The higher the OCV, the more the player contributed to the team's final score. The lowest value of this metric is zero for those players who scored no goal, and it can go above three, as it is the sum of each player's AGVs.
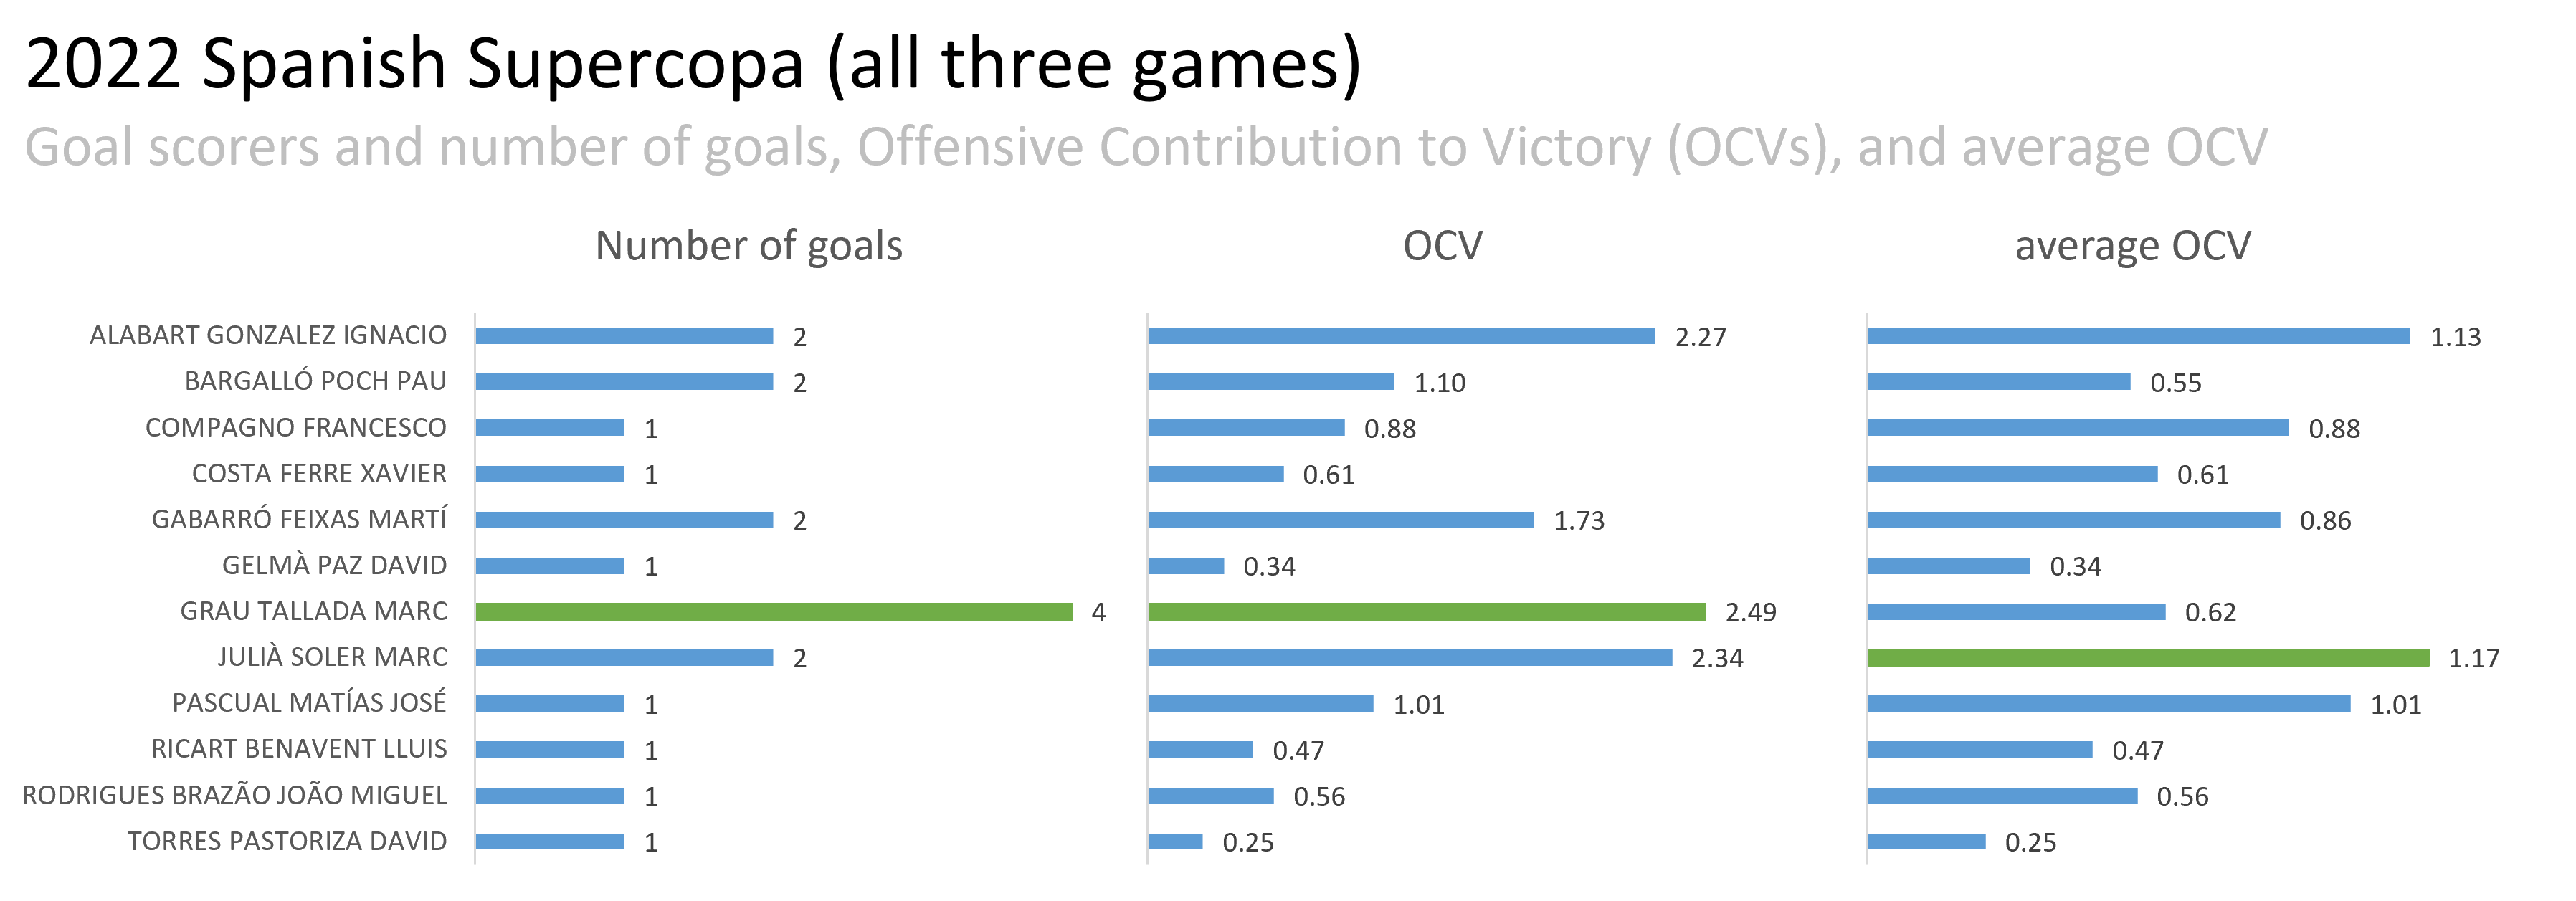
There's no reason why we should stop at the game level. These OCVs are super interesting to track, for example, within a competition, season, or even along players' careers. For the Supercopa, the number of games is small, so it's hard to expose patterns and draw conclusions. Still, in collaboration with Marc Oller (@marcollergarcia on twitter), we generated a Player's Offensive Contribution to Victory ranking for the 2022 Spanish Supercopa to set an example of the potential of this metric (see table below). Marc Grau had the largest OCV and was the top goal scorer. However, Marc Julià and Ignacio Alabart had almost the same OCV as Marc Grau, with half the goals. In fact, both of them had an average OCV larger than Marc Grau's, suggesting that Marc Julià and Ignacio Alabart scored (on average) more relevant goals than Marc Grau (who scored relevant and no so relevant goals). Hmmm, interesting.

Of course, we're talking about a tiny number of games (it is what it is, guys, the whole Supercopa is only three games). But incorporating OCVs into the analysis of the Supercopa opens up questions such as "who's the Supercopa most valuable player?" with a little more sense than just counting goals. After all, we quantified the value of each goal and not just the number of goals. So, the top OCV player was Marc Grau, with 2.49 points, and he could be the most valuable player. He alone contributed to his team in just two games with almost one victory. Impressive. So were Marc Julià and Ignacio Alabart, who contributed nearly as much as (2.34 and 2.27, respectively). Notice we used "top OCV player" rather than most valuable player. We will, eventually, be able to quantify the most valuable player. But that'll be in another blog. We want to be consistent with our terminology. We quantified the players offensive contribution to victory, and with those data, the most valuable player was Marc Grau.
Well, we almost finished the first okjectivity blog. But before, just a quick comment that we can also measure teams' OCVs. Just as we do players, but summing up all the contributing players in a team. In our Supercopa example, Barça got an impressive 7.4 OCV (above six, the value of two victories). Reus got a 3.6, Noia a 2.3, and Liceo a 0.71. Again, this classification provides a deeper insight into the Supercopa than just looking at the number of games played or goals scored by each team. For example, it shows that Noia played an excellent game. Despite losing in the semifinals, it was close to the three-point value of a victory. Liceo also lost its semifinal but got a 0.71 OCV. Of course, numbers are just numbers, with strengths and weaknesses. Liceo played an excellent game, mainly if you think the team is under construction, with last year's core players no longer playing for the team and many new players playing together for the first time. In fact, Liceo was winning 2 – 0 in the first part of the semifinal against Reus. But we already know the score is prone to change with time, and it sure did. Reus scored three goals in the second part to end up in the final. Lastly, just as the final example of the possibilities of the OCV analyses, Marc Grau contributed 33.5% of his team's OCV, closely followed by Ignacio Alabart (30.5%) and Pau Bargalló (14.8%). In comparison, Marc Julià contributed 65.7% to the Reus' OCV, followed by Francesco Campagno (24.7%) and David Gelmà (9.6%). We can use those numbers to measure the players' importance in the team or team dependencies on specific players.
With only three games, the Spanish Supercopa is not the best championship to analyze trends or draw conclusions (our numbers show what happened, though). It did help us present you these metrics and a quick snapshot of their potential use to study not only your team and players but also your opponents'. Will Marc Grau be more determinant in Barça than Marc Julià in Reus during the regular season? We'll soon post metrics from some of the top Spanish leagues and will be delighted to see if you generate numbers from your team or league, regardless of country, league, or team you play. Please let us know how you use these metrics in the comments below. You can also post them on your Instagram and let us know (@okjectivity). We'll be happy to learn from you and appreciate any positive, constructive comment that helps the hockey community progress in the sport we love.
Marc Oller is the current Switzerland women's national rink-hockey team coach and you can learn from him @marcollergarcia in twitter, where he is very active.